State of charge is the coordinate the battery field organizes most of its thinking around. A cell is at 0%, the cell is at 50%, the cell is at 100%. The number summarizes how much lithium is on which side of the cell and how much usable energy is available. It is the most reported, most measured, most relied-upon parameter in the industry.
It is also a one-number summary of a system that is, internally, not a one-number system.
Two cells at the same nominal state of charge are not necessarily in the same microscopic configuration. The field has reasoned about this for years — cycling history matters, charging rate matters, temperature history matters, defect distributions matter — without being able to directly observe the underlying microstate differences that the macroscopic number averages over. The methodology to actually see those differences, at quantum resolution, in connected trajectories that show how the cell reached its current configuration, has not existed.
It does now. What follows is one of the first things we found when we used it.
The finding.
We ran the lab-perfect baseline on NMC811-IQ. The SaC produced emergent microstates across the full lithiation range. The seam construction pipeline assembled them into complete charge-cycle trajectories — master seams — running from near-empty to near-full lithium content, validated frame by frame.
The plan was to produce one master seam per direction of cycling. The SaC had other ideas. The lithiation pass produced multiple complete trajectories, each valid under the seam construction criteria, each covering the full operating range, each reaching the same nominal states of charge along the way. The trajectories were not the same. They reached the same macroscopic milestones via different microscopic paths.
At 50% state of charge, on the same baseline material, in the same direction of lithiation, two of these master seams show configurations whose macroscopic observables agree and whose microscopic quantum structure does not. Same Li fraction. Same direction. Different lattice configurations, different spin observables, different signatures in the basis-mismatch rendering, different transverse coherence patterns.
Not noise. The configurations reproduce across independent runs of the same root circuit with the same engine settings. Not artifact. The differences pass the same physical continuity checks that the rest of the master seam frames pass. Not interpolation. Both configurations are the validated output of the SaC engine's evolution, not a fitted average or an inferred state.
What the result says, in plain terms: the cell at 50% SOC can be in distinct microstates depending on which of several physically valid paths it took to get there. The macroscopic coordinate is a one-number summary of a configuration space that contains more than one configuration at that coordinate.
Why it matters.
The straightforward consequence: any decision a battery program makes on the basis of state of charge alone is averaging over microstates that may differ in ways that affect downstream behavior. Two cells that read 50% SOC on a coulomb counter are not necessarily equivalent for the purposes of predicting cycling life, voltage response, or failure susceptibility. The number is correct; the conclusion that two cells with the same number are in the same state is not necessarily warranted.
The less obvious consequence: this is the kind of structure that only becomes legible when the methodology produces connected trajectories. A snapshot library of 50% SOC configurations would have shown the same multi-variant population without saying anything about which microstates are connected to which paths, and the result would have read as noise or as ambiguity in the coordinate definition. Connected state evolution makes it clear that each variant belongs to a distinct trajectory the cell actually traveled. The path is not ambiguous; it is multiple.
The further consequence: the methodology generalizes. If 50% SOC is multi-variant on a lab-perfect baseline of a well-studied cathode, every other operating point on every other cell is almost certainly multi-variant too. The 50% finding is not a special property of 50%; it is the most prominent example, on the cleanest possible study, of a phenomenon that is everywhere in real cells. The first cell-level question worth asking is not whether this happens. It is which paths the cell is taking and what determines the choice.
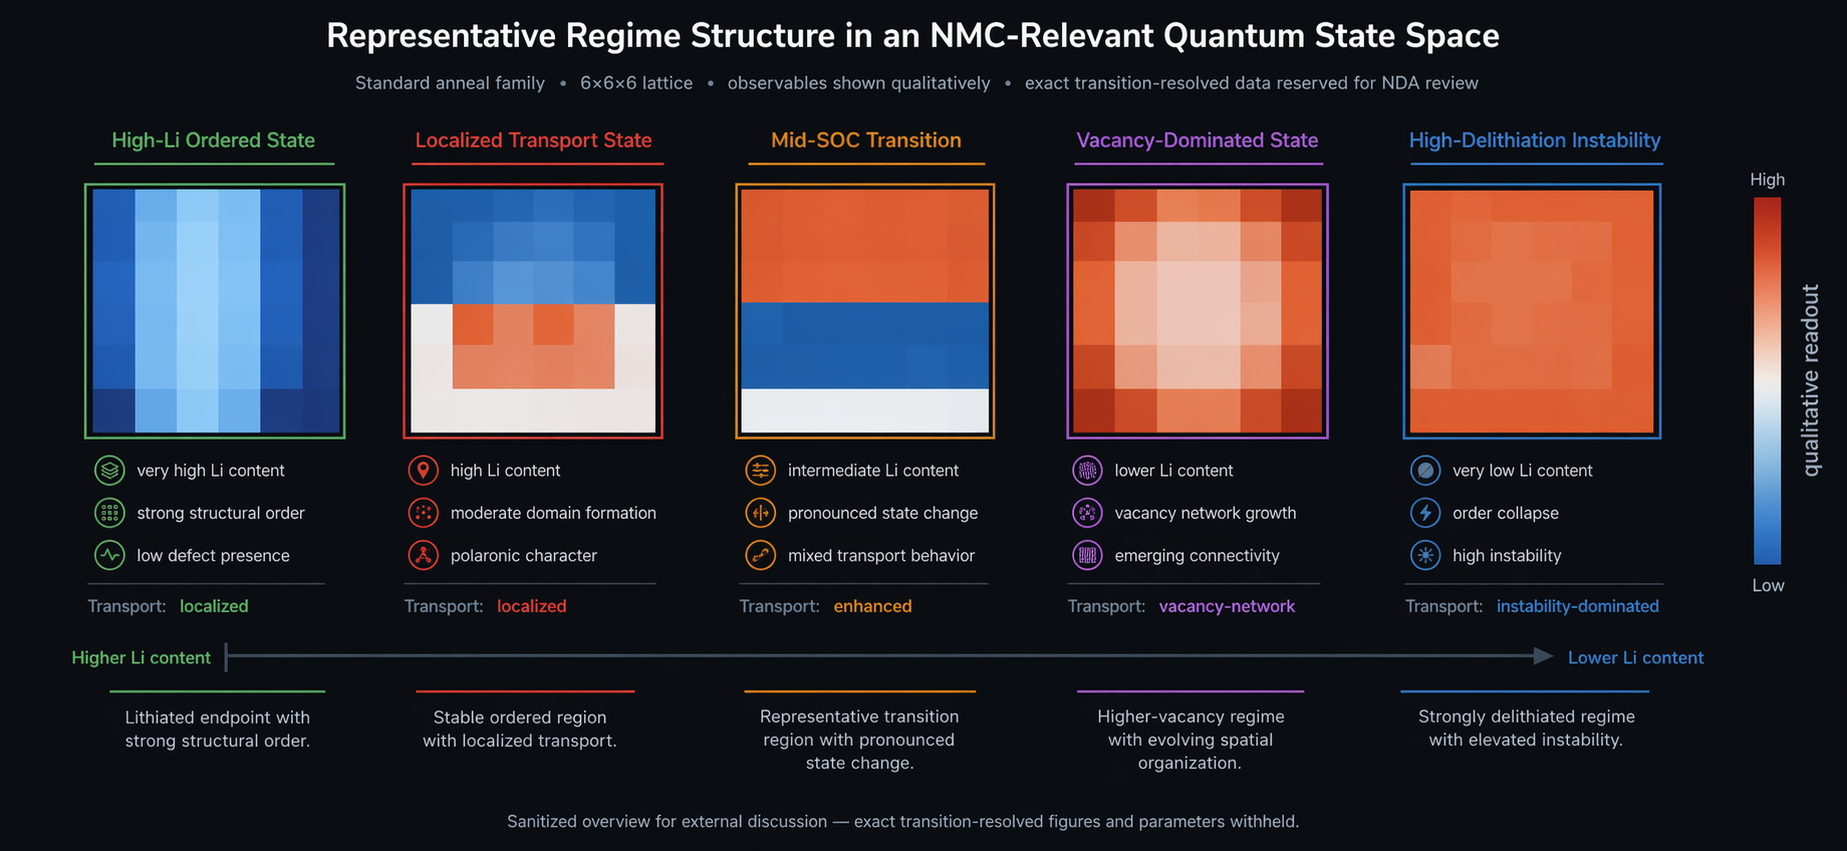
What the viewer shows.
The dashboard's ten lattice rendering modes were not built for marketing imagery. They were built because no single view of these two configurations was sufficient to make their differences readable. The canonical Z view shows lithium-vacancy structure that differs subtly between the two variants. The transverse-magnitude view shows where in-plane spin amplitude is localized differently. The XY-phase view shows the two configurations occupying different regions of color space at the same nominal coordinate. The Z-versus-X mismatch view, often the most diagnostically distinct, shows the variants diverging in exactly the basis-dependent way that single-basis measurement would never detect.
The combined RGB rendering, with the three Pauli observables mapped to color channels, makes the divergence visible at a glance: same macrostate, distinguishably different microscopic structure. Once you have seen it, the methodology's purpose stops being a claim and starts being self-evident.
The parallel from the magnet track.
From what the magnet team has shared, the TFIM-pure sweep they have been running shows its own multi-variant pattern: at certain coupling values, the post-circuit lattice evolution produces qualitatively different end states from runs that began with nearly identical pulse sequences and the same starting configuration. Same input regime. Different reachable outcomes. Reproducible across independent runs of the same sweep.
Different material system. Different parameter axis. Different coordinate that the field has historically treated as a single summary number. The same shape of finding: macroscopic coordinates that average over distinguishable microscopic trajectories the system actually takes. The magnet team will document their version through benchmarks.iqintel.io on their own terms; what we can say from cross-track meetings is that multi-variance under fixed macroscopic coordinates is showing up independently in both studies. It is starting to look less like a battery-specific curiosity and more like a property of how the engine reads the physics.
The first finding worth publishing.
We chose to publish this because it is concrete, reproducible, and concrete-with-consequences. It is the kind of result that explains what Subatomic Computing is for better than any methodological description can. The cell at 50% SOC is not in one state. We can show which states it can be in. We can show how it got to each of them. We can show what each one looks like at quantum resolution, frame by frame, on the same dashboard.
A research program that cares about predicting cycling life, diagnosing failure modes, or designing cells for specific operating profiles now has a methodology that produces the microscopic detail those questions actually depend on. The macroscopic coordinate stays in the data; it is now one of several axes the analysis operates over, instead of the only one the methodology can resolve.
The series ends here for now. The first study has finished what it set out to finish, and a few things it did not. The defect studies are next, parameterized from real-world characterization data that customers bring to the engagement. What the cell looks like when your specific defects are in it — what paths it takes through state space, which microstates it dwells in, where the multi-variance gets sharper or softer — is the question the engine was built to answer.
The signal goes quiet here for now. The work does not.
That is the question the engagement was built to answer.
The engagement runs the trajectory forward and surfaces the microstates your cells actually occupy — not the one-number summary they get averaged into.
Request a confidential discussion